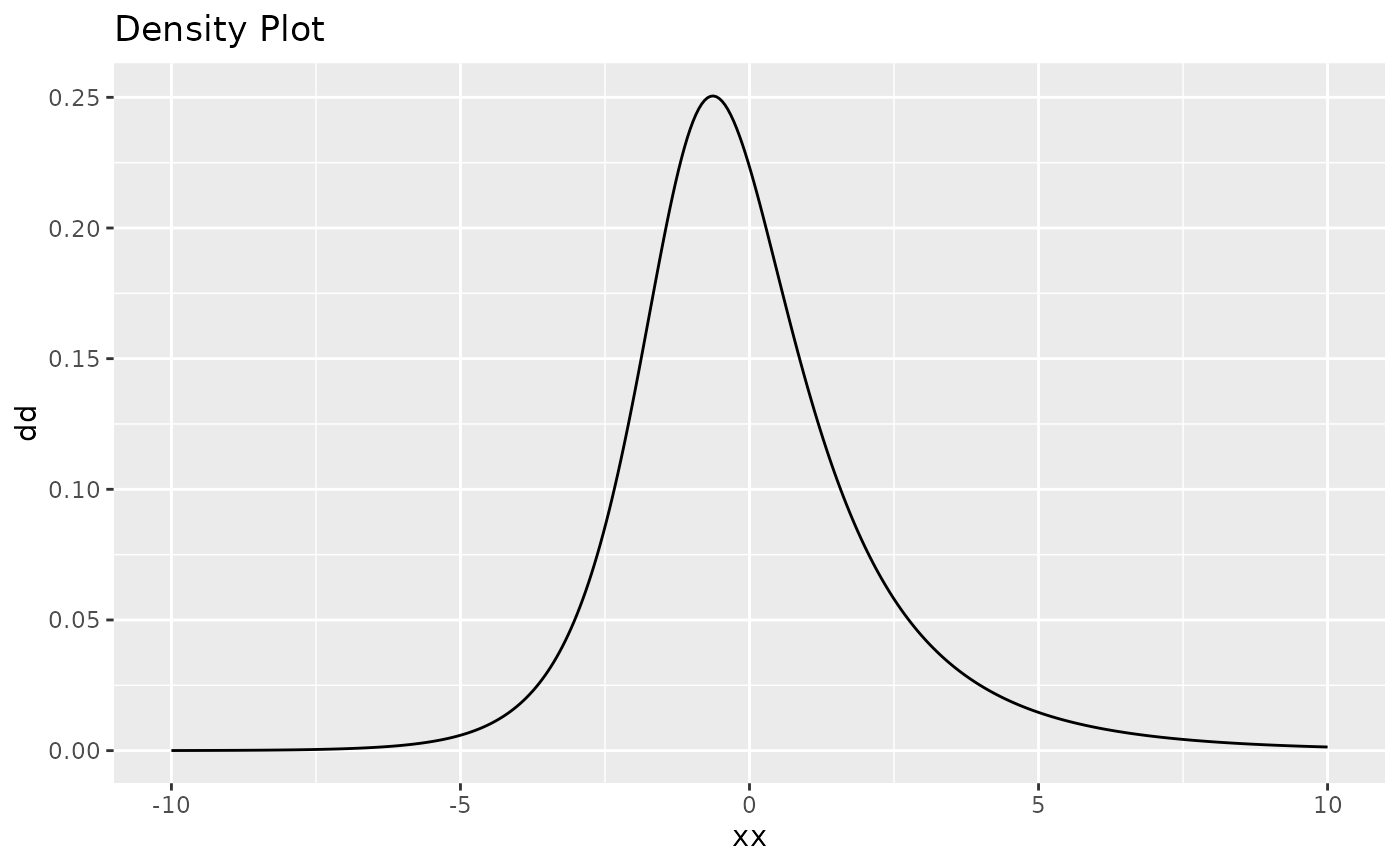
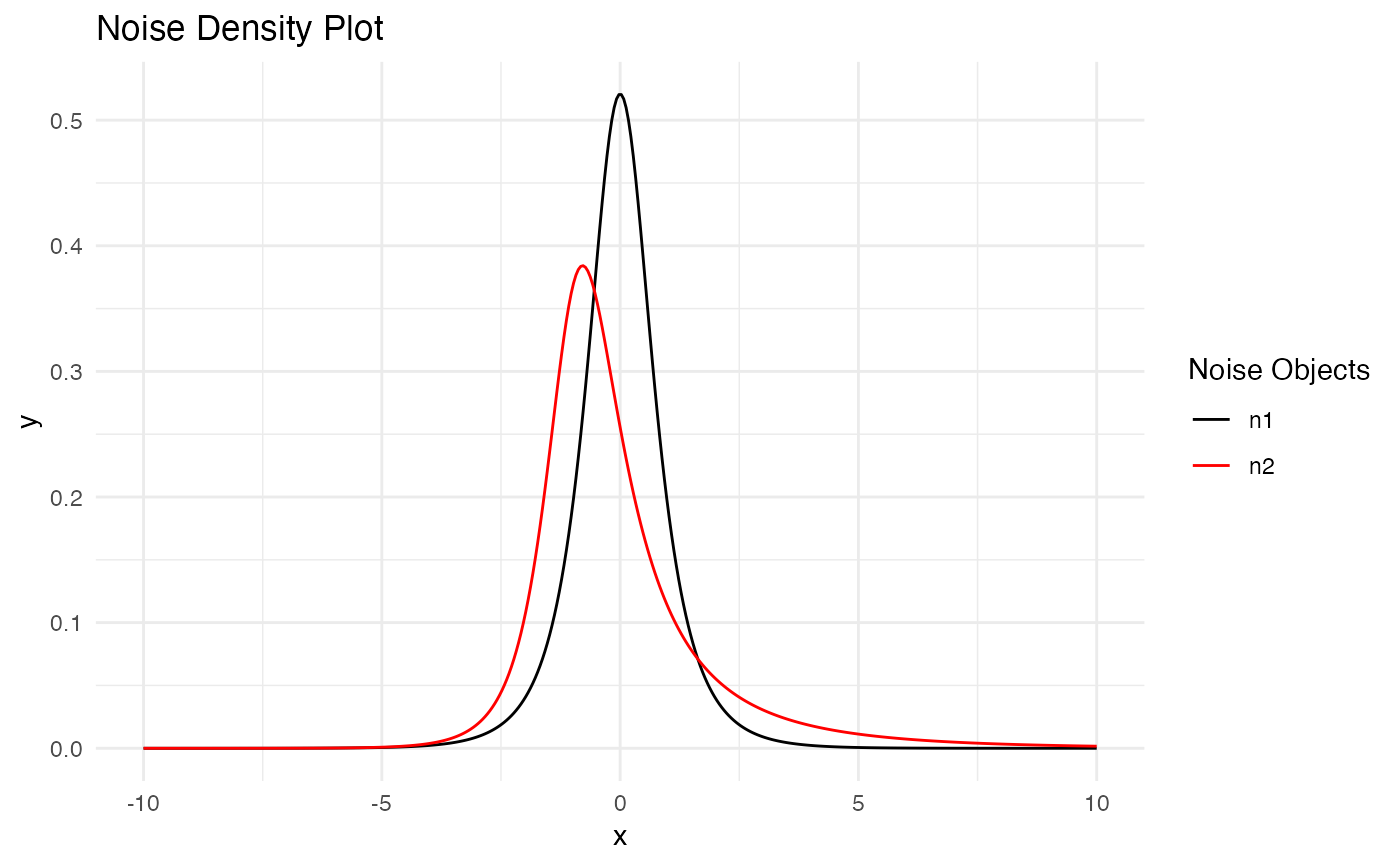
This function plots the probability density function for one or more stationary noise objects (e.g., NIG, GAL, or normal noise). Multiple noise objects can be compared on the same plot.
Usage
# S3 method for class 'ngme_noise'
plot(x = NULL, ...)This function plots the probability density function for one or more stationary noise objects (e.g., NIG, GAL, or normal noise). Multiple noise objects can be compared on the same plot.
# S3 method for class 'ngme_noise'
plot(x = NULL, ...)