Class representing a general metric graph.
Value
Object of R6Class for creating metric graphs.
Details
A graph object created from vertex and edge matrices, or from an
sp::SpatialLines object where each line is representing and edge. For more
details, see the vignette:
vignette("metric_graph", package = "MetricGraph")
Public fields
VMatrix with positions in Euclidean space of the vertices of the graph.
nVThe number of vertices.
EMatrix with the edges of the graph, where each row represents an edge,
E[i,1]is the vertex at the start of the ith edge andE[i,2]is the vertex at the end of the edge.nEThe number of edges.
edge_lengthsVector with the lengths of the edges in the graph.
CConstraint matrix used to set Kirchhoff constraints.
CoBChange-of-basis object used for Kirchhoff constraints.
PtVVector with the indices of the vertices which are observation locations.
meshMesh object used for plotting.
edgesThe coordinates of the edges in the graph.
DirectionalWeightFunction_inFunction for inwards weights in directional models
DirectionalWeightFunction_outFunction for outwards weights in directional models
verticesThe coordinates of the vertices in the graph, along with several attributes.
geo_distGeodesic distances between the vertices in the graph.
res_distResistance distances between the observation locations.
LaplacianThe weighted graph Laplacian of the vertices in the graph. The weights are given by the edge lengths.
characteristicsList with various characteristics of the graph.
Methods
metric_graph$new()
Create a new metric_graph object.
Usage
metric_graph$new(
  edges = NULL,
  V = NULL,
  E = NULL,
  vertex_unit = NULL,
  length_unit = NULL,
  edge_weights = NULL,
  kirchhoff_weights = NULL,
  directional_weights = NULL,
  longlat = NULL,
  crs = NULL,
  proj4string = NULL,
  which_longlat = "sp",
  include_obs = NULL,
  include_edge_weights = NULL,
  project = FALSE,
  project_data = FALSE,
  which_projection = "Winkel tripel",
  manual_edge_lengths = NULL,
  perform_merges = NULL,
  approx_edge_PtE = TRUE,
  tolerance = list(vertex_vertex = 0.001, vertex_edge = 0.001, edge_edge = 0),
  check_connected = TRUE,
  remove_deg2 = FALSE,
  merge_close_vertices = NULL,
  factor_merge_close_vertices = 1,
  remove_circles = FALSE,
  auto_remove_point_edges = TRUE,
  verbose = 1,
  add_obs_options = list(return_removed = FALSE, verbose = verbose),
  lines = deprecated(),
  .assemble = NULL
)
Arguments
edgesA list containing coordinates as
m x 2matrices (that is, ofmatrixtype) or m x 2 data frames (data.frametype) of sequence of points connected by straightlines. Alternatively, you can also prove an object of typeSSN,osmdata_sp,osmdata_sf,SpatialLinesDataFrameorSpatialLines(fromsppackage) orMULTILINESTRING(fromsfpackage).Vn x 2 matrix with Euclidean coordinates of the n vertices. If non-NULL, no merges will be performed.
Em x 2 matrix where each row represents one of the m edges. If non-NULL, no merges will be performed.
vertex_unitThe unit in which the vertices are specified. The options are 'degree' (the great circle distance in km), 'km', 'm' and 'miles'. The default is
NULL, which means no unit. However, if you setlength_unit, you need to setvertex_unit.length_unitThe unit in which the lengths will be computed. The options are 'km', 'm' and 'miles'. The default, when longlat is
TRUE, or ansforspobjects are provided, is 'km'.edge_weightsEither a number, a numerical vector with length given by the number of edges, providing the edge weights, or a
data.framewith the number of rows being equal to the number of edges, where each row gives a vector of weights to its corresponding edge. Can be changed by using theset_edge_weights()method.kirchhoff_weightsIf non-null, the name (or number) of the column of
edge_weightsthat contain the Kirchhoff weights. Must be equal to 1 (orTRUE) in caseedge_weightsis a single number and those are the Kirchhoff weights.directional_weightsIf non-null, the name (or number) of the column of
edge_weightsthat contain the directional weights. The default is the first column of the edge weights.longlatThere are three options:
NULL,TRUEorFALSE. IfNULL(the default option), theedgesargument will be checked to see if there is a CRS or proj4string available, if so,longlatwill be set toTRUE, otherwise, it will be set toFALSE. IfTRUE, then it is assumed that the coordinates are given. in Longitude/Latitude and that distances should be computed in meters. IfTRUEit takes precedence oververtex_unitandlength_unit, and is equivalent tovertex_unit = 'degree'andlength_unit = 'm'.crsCoordinate reference system to be used in case
longlatis set toTRUEandwhich_longlatissf. Object of class crs. The default choice, if theedgesobject does not have CRS nor proj4string, issf::st_crs(4326).proj4stringProjection string of class CRS-class to be used in case
longlatis set toTRUEandwhich_longlatissp. The default choice, if theedgesobject does not have CRS nor proj4string, issp::CRS("+proj=longlat +datum=WGS84").which_longlatCompute the distance using which package? The options are
spandsf. The default issp.include_obsIf the object is of class
SSN, should the observations be added? IfNULLand the edges are of classSSN, the data will be automatically added. IfFALSE, the data will not be added. Alternatively, one can set this argument to the numbers or names of the columns of the observations to be added as observations.include_edge_weightsIf the object is of class
SSN,osmdata_sp,osmdata_sf,SpatialLinesDataFrame,MULTILINESTRING,LINESTRING,sfc_LINESTRING,sfc_MULTILINESTRING, should the edge data (if any) be added as edge weights? IfNULL, the edge data will be added as edge weights, ifFALSEthey will not be added. Alternatively, one can set this argument to the numbers or names of the columns of the edge data to be added as edge weights.projectIf
longlatisTRUEshould a projection be used to compute the distances to be used for the tolerances (seetolerancebelow)? The default isFALSE. WhenTRUE, the construction of the graph is faster.project_dataIf
longlatisTRUEshould the vertices be project to planar coordinates? The default isFALSE. WhenTRUE, the construction of the graph is faster.which_projectionWhich projection should be used in case
projectisTRUE? The options areRobinson,Winkel tripelor a proj4string. The default isWinkel tripel.manual_edge_lengthsIf non-NULL, a vector containing the edges lengths, and all the quantities related to edge lengths will be computed in terms of these. If merges are performed, it is likely that the merges will override the manual edge lengths. In such a case, to provide manual edge lengths, one should either set the
perform_mergesargument toFALSEor use theset_manual_edge_lengths()method.perform_mergesThere are three options,
NULL,TRUEorFALSE. The default option isNULL. IfNULL, it will be set toFALSEunless 'edges', 'V' and 'E' areNULL, in which case it will be set toTRUE. If FALSE, this will take priority over the other arguments, and no merges (except the optionalmerge_close_verticesbelow) will be performed. Note that the merge on the additionalmerge_close_verticesmight still be performed, if it is set toTRUE.approx_edge_PtEShould the relative positions on the edges be approximated? The default is
TRUE. IfFALSE, the speed can be considerably slower, especially for large metric graphs.toleranceList that provides tolerances during the construction of the graph:
vertex_vertexVertices that are closer than this number are merged (default = 1e-7).vertex_edgeIf a vertex at the end of one edge is closer than this number to another edge, this vertex is connected to that edge (default = 1e-7). Previouslyvertex_line, which is now deprecated.edge_edgeIf two edges at some point are closer than this number, a new vertex is added at that point and the two edges are connected (default = 0).vertex_line, Deprecated. Usevertex_edgeinstead.line_line, Deprecated. Useedge_edgeinstead.
In case
longlat = TRUE, the tolerances are given inlength_unit.check_connectedIf
TRUE, it is checked whether the graph is connected and a warning is given if this is not the case.remove_deg2Set to
TRUEto remove all vertices of degree 2 in the initialization. Default isFALSE.merge_close_verticesShould an additional step to merge close vertices be done? The options are
NULL(the default),TRUEorFALSE. IfNULL, it will be determined automatically. IfTRUEthis step will be performed even ifperfom_mergesis set toFALSE.factor_merge_close_verticesWhich factor to be multiplied by tolerance
vertex_vertexwhen merging close vertices at the additional step?remove_circlesAll circlular edges with a length smaller than this number are removed. If
TRUE, thevertex_vertextolerance will be used. IfFALSE, no circles will be removed.auto_remove_point_edgesShould edges of length zero, that is, edges that are actually points, be automatically removed?
verbosePrint progress of graph creation. There are 3 levels of verbose, level 0, 1 and 2. In level 0, no messages are printed. In level 1, only messages regarding important steps are printed. Finally, in level 2, messages detailing all the steps are printed. The default is 1.
add_obs_optionsList containing additional options to be passed to the
add_observations()method when adding observations fromSSNdata?lines![[Deprecated]](figures/lifecycle-deprecated.svg) Use
Use edgesinstead..assembleExpert option for assembling the graph by skipping the entire constructor pipeline and instead populate the R6 object directly from a pre-computed list. Intended for internal use.
Details
A graph object can be initialized in two ways. The first method
is to specify V and E. In this case, all edges are assumed to be straight
lines. The second option is to specify the graph via the lines input.
In this case, the vertices are set by the end points of the lines.
Thus, if two lines are intersecting somewhere else, this will not be
viewed as a vertex.
metric_graph$remove_small_circles()
Sets the edge weights
Arguments
toleranceTolerance at which circles with length less than this will be removed.
verbosePrint progress of graph creation. There are 3 levels of verbose, level 0, 1 and 2. In level 0, no messages are printed. In level 1, only messages regarding important steps are printed. Finally, in level 2, messages detailing all the steps are printed. The default is 1.
metric_graph$get_edges()
Exports the edges of the MetricGraph object as an sf or sp.
Usage
metric_graph$get_edges(format = c("sf", "sp", "list"))metric_graph$get_bounding_box()
Bounding box of the metric graph
metric_graph$get_vertices()
Exports the vertices of the MetricGraph object as an sf,
sp or as a matrix.
Usage
metric_graph$get_vertices(format = c("sf", "sp", "list"))metric_graph$export()
Exports the MetricGraph object as an sf or sp object.
Returns
Returns a list with three elements: edges, vertices, and data.
For format == "sf", edges is an sf object of LINESTRING geometries
with edge weights, and vertices and data are sf objects with
POINT geometries.
For format == "sp", edges is a SpatialLinesDataFrame with edge weights,
and vertices and data are SpatialPointsDataFrame.
metric_graph$leaflet()
Return the metric graph as a leaflet::leaflet() object to
be built upon.
Usage
metric_graph$leaflet(
  width = NULL,
  height = NULL,
  padding = 0,
  options = leafletOptions(),
  elementId = NULL,
  sizingPolicy = leafletSizingPolicy(padding = padding)
)
Arguments
widththe width of the map
heightthe height of the map
paddingthe padding of the map
optionsthe map options
elementIdUse an explicit element ID for the widget (rather than an automatically generated one).
sizingPolicyhtmlwidgets sizing policy object. Defaults to
leafletSizingPolicy().
metric_graph$mapview()
Returns a mapview::mapview() object of the metric graph
Arguments
...Additional arguments to be passed to
mapview::mapview(). Thexargument of mapview, containing the metric graph is already passed internally.
metric_graph$set_edge_weights()
Sets the edge weights
Usage
metric_graph$set_edge_weights(
  weights = NULL,
  kirchhoff_weights = NULL,
  directional_weights = NULL,
  verbose = 0
)
Arguments
weightsEither a number, a numerical vector with length given by the number of edges, providing the edge weights, or a
data.framewith the number of rows being equal to the number of edges, where each row gives a vector of weights to its corresponding edge.kirchhoff_weightsIf non-null, the name (or number) of the column of
weightsthat contain the Kirchhoff weights. Must be equal to 1 (orTRUE) in caseweightsis a single number and those are the Kirchhoff weights.directional_weightsIf non-null, the name (or number) of the column of
weightsthat contain the directional weights.verboseThere are 3 levels of verbose, level 0, 1 and 2. In level 0, no messages are printed. In level 1, only messages regarding important steps are printed. Finally, in level 2, messages detailing all the steps are printed. The default is 1.
metric_graph$get_edge_weights()
Gets the edge weights
Usage
metric_graph$get_edge_weights(
  data.frame = FALSE,
  format = c("tibble", "sf", "sp", "list"),
  tibble = deprecated()
)
Arguments
data.frameIf the edge weights are given as vectors, should the result be returned as a data.frame?
formatWhich format should the data be returned? The options are
tibblefortidyr::tibble,sfforPOINT,spforSpatialPointsDataFrameandlistfor the internal list format.tibble- Use
formatinstead.
metric_graph$summary()
Prints a summary of various informations of the graph
Usage
metric_graph$summary(
  messages = FALSE,
  compute_characteristics = NULL,
  check_euclidean = NULL,
  check_distance_consistency = NULL
)
Arguments
messagesShould message explaining how to build the results be given for missing quantities?
compute_characteristicsShould the characteristics of the graph be computed? If
NULLit will be determined based on the size of the graph.check_euclideanCheck if the graph has Euclidean edges? If
NULLit will be determined based on the size of the graph.check_distance_consistencyCheck the distance consistency assumption? If
NULLit will be determined based on the size of the graph.
metric_graph$compute_characteristics()
Computes various characteristics of the graph
Arguments
check_euclideanAlso check if the graph has Euclidean edges? This essentially means that the distance consistency check will also be perfomed. If the graph does not have Euclidean edges due to another reason rather than the distance consistency, then it will already be indicated that the graph does not have Euclidean edges.
metric_graph$compute_geodist()
Computes shortest path distances between the vertices in the graph
Usage
metric_graph$compute_geodist(
  obs = TRUE,
  include_vertices = FALSE,
  all_groups = FALSE,
  group = NULL,
  verbose = 0,
  full = lifecycle::deprecated()
)
Arguments
obsShould the geodesic distances be computed at the observation locations or only at vertices?
include_verticesIf
obsisTRUE, should the vertex locations be included in the resulting distance matrix?all_groupsShould the geodesic distances be computed for all the available locations accross all groups? If
FALSE, it will be computed separately for the locations of each group.groupVector or list containing which groups to compute the distance for. If
NULL, it will be computed for all groups.verbosePrint progress of the computation of the geodesic distances. There are 3 levels of verbose, level 0, 1 and 2. In level 0, no messages are printed. In level 1, only messages regarding important steps are printed. Finally, in level 2, messages detailing all the steps are printed. The default is 1.
full- Use
all_groupsinstead.
metric_graph$compute_geodist_PtE()
Computes shortest path distances between the vertices in the graph.
Usage
metric_graph$compute_geodist_PtE(
  PtE,
  normalized = TRUE,
  include_vertices = TRUE,
  verbose = 0
)
Arguments
PtEPoints to compute the metric for.
normalizedare the locations in PtE in normalized distance?
include_verticesShould the original vertices be included in the distance matrix?
verbosePrint progress of the computation of the geodesic distances. There are 3 levels of verbose, level 0, 1 and 2. In level 0, no messages are printed. In level 1, only messages regarding important steps are printed. Finally, in level 2, messages detailing all the steps are printed. The default is 1.
metric_graph$compute_geodist_mesh()
Computes shortest path distances between the vertices in the mesh.
metric_graph$compute_resdist()
Computes the resistance distance between the observation locations.
Usage
metric_graph$compute_resdist(
  full = FALSE,
  obs = TRUE,
  group = NULL,
  check_euclidean = FALSE,
  include_vertices = FALSE,
  verbose = 0
)
Arguments
fullShould the resistance distances be computed for all the available locations. If
FALSE, it will be computed separately for the locations of each group.obsShould the resistance distances be computed at the observation locations?
groupVector or list containing which groups to compute the distance for. If
NULL, it will be computed for all groups.check_euclideanCheck if the graph used to compute the resistance distance has Euclidean edges? The graph used to compute the resistance distance has the observation locations as vertices.
include_verticesShould the vertices of the graph be also included in the resulting matrix when using
FULL=TRUE?verbosePrint progress of the computation of the resistance distances. There are 3 levels of verbose, level 0, 1 and 2. In level 0, no messages are printed. In level 1, only messages regarding important steps are printed. Finally, in level 2, messages detailing all the steps are printed. The default is 1.
metric_graph$compute_resdist_PtE()
Computes the resistance distance between the observation locations.
Usage
metric_graph$compute_resdist_PtE(
  PtE,
  normalized = TRUE,
  include_vertices = FALSE,
  check_euclidean = FALSE,
  verbose = 0
)
Arguments
PtEPoints to compute the metric for.
normalizedAre the locations in PtE in normalized distance?
include_verticesShould the original vertices be included in the Laplacian matrix?
check_euclideanCheck if the graph used to compute the resistance distance has Euclidean edges? The graph used to compute the resistance distance has the observation locations as vertices.
verbosePrint progress of the computation of the resistance distances. There are 3 levels of verbose, level 0, 1 and 2. In level 0, no messages are printed. In level 1, only messages regarding important steps are printed. Finally, in level 2, messages detailing all the steps are printed. The default is 1.
metric_graph$get_degrees()
Returns the degrees of the vertices in the metric graph.
metric_graph$compute_PtE_edges()
Computes the relative positions of the coordinates of the
edges and save it as an attribute to each edge. This improves the quality
of plots obtained by the plot_function() method, however it might
be costly to compute.
metric_graph$compute_resdist_mesh()
Computes the resistance metric between the vertices in the mesh.
metric_graph$compute_laplacian()
Computes the weigthed graph Laplacian for the graph.
Arguments
fullShould the resistance distances be computed for all the available locations. If
FALSE, it will be computed separately for the locations of each group.obsShould the resistance distances be computed at the observation locations? It will only compute for locations in which there is at least one observations that is not NA.
groupVector or list containing which groups to compute the Laplacian for. If
NULL, it will be computed for all groups.verbosePrint progress of the computation of the Laplacian. There are 3 levels of verbose, level 0, 1 and 2. In level 0, no messages are printed. In level 1, only messages regarding important steps are printed. Finally, in level 2, messages detailing all the steps are printed. The default is 1.
metric_graph$prune_vertices()
Removes vertices of degree 2 from the metric graph.
Arguments
check_weightsIf
TRUEwill only prune edges with different weights.check_circlesIf
TRUEwill not prune a vertex such that the resulting edge is a circle.verbosePrint progress of pruning. There are 3 levels of verbose, level 0, 1 and 2. In level 0, no messages are printed. In level 1, only messages regarding important steps are printed. Finally, in level 2, messages detailing all the steps are printed. The default is 1.
metric_graph$set_manual_edge_lengths()
Gets the groups from the data.
metric_graph$observation_to_vertex()
Adds observation locations as vertices in the graph.
Usage
metric_graph$observation_to_vertex(
  mesh_warning = TRUE,
  verbose = 0,
  tolerance = deprecated()
)
Arguments
mesh_warningDisplay a warning if the graph structure change and the metric graph has a mesh object.
verbosePrint progress of the steps when adding observations. There are 3 levels of verbose, level 0, 1 and 2. In level 0, no messages are printed. In level 1, only messages regarding important steps are printed. Finally, in level 2, messages detailing all the steps are printed. The default is 1.
tolerance- . Not used anymore
share_weightsShould the same weight be shared among the split edges? If
FALSE, the weights will be removed, and a common weight given by 1 will be given.
metric_graph$edgeweight_to_data()
Turns edge weights into data on the metric graph
Arguments
locA
matrixordata.framewith two columns containing the locations to generate the data from the edge weights. Ifdata_coordsis 'spatial', the first column must be the x-coordinate of the data, and the second column must be the y-coordinate. Ifdata_coordsis 'PtE', the first column must be the edge number and the second column must be the distance on edge.meshShould the data be generated to the mesh locations? In this case, the
locargument will be ignored. Observe that the metric graph must have a mesh built for one to use this option. CAUTION: To add edgeweight to data to both the data locations and mesh locations, please, add at the data locations first, then to mesh locations.data_locShould the data be generated to the data locations? In this case, the
locargument will be ignored. Observe that the metric graph must have data for one to use this option. CAUTION: To add edgeweight to data to both the data locations and mesh locations, please, add at the data locations first, then to mesh locations.weight_colWhich columns of the edge weights should be turned into data? If
NULL, all columns will be turned into data.addShould the data generated be added to the metric graph internal data?
data_coordsTo be used only if
meshisFALSE. It decides which coordinate system to use. IfPtE, the user must provideedge_numberanddistance_on_edge, otherwise ifspatial, the user must providecoord_xandcoord_y.normalizedif TRUE, then the distances in
distance_on_edgeare assumed to be normalized to (0,1). Default FALSE.tibbleShould the data be returned in a
tibbleformat?formatIf
returnisTRUE, the format of the output: "tibble", "sf", or "sp". Default is "tibble".verbosePrint progress of the steps when adding observations. There are 3 levels of verbose, level 0, 1 and 2. In level 0, no messages are printed. In level 1, only messages regarding important steps are printed. Finally, in level 2, messages detailing all the steps are printed. The default is 1.
suppress_warningsSuppress warnings related to duplicated observations?
returnShould the data be returned? If
return_removedisTRUE, only the removed locations will be return (if there is any).
metric_graph$get_mesh_locations()
Returns a list or a matrix with the mesh locations.
Usage
metric_graph$get_mesh_locations(
  bru = FALSE,
  loc = c(".edge_number", ".distance_on_edge"),
  loc_name = NULL,
  normalized = TRUE
)
Arguments
bruShould an 'inlabru'-friendly list be returned?
locIf
bruis set toTRUE, the column names of the location variables. The default name isc('.edge_number', '.distance_on_edge').loc_nameThe name of the location variables. Not needed for
rSPDEmodels.normalizedIf TRUE, then the distances in
distance_on_edgeare assumed to be normalized to (0,1). Default TRUE.
metric_graph$process_data()
Process data to the metric graph data format.
Usage
metric_graph$process_data(
  data = NULL,
  edge_number = "edge_number",
  distance_on_edge = "distance_on_edge",
  coord_x = "coord_x",
  coord_y = "coord_y",
  data_coords = c("PtE", "spatial"),
  group = NULL,
  group_sep = ".",
  normalized = FALSE,
  format = c("tibble", "sf", "sp", "list"),
  duplicated_strategy = "closest",
  include_distance_to_graph = TRUE,
  only_return_removed = FALSE,
  tolerance = max(self$edge_lengths)/2,
  verbose = FALSE,
  suppress_warnings = FALSE,
  Spoints = lifecycle::deprecated(),
  tibble = lifecycle::deprecated()
)
Arguments
dataA
data.frameor named list containing the observations. In case of groups, the data.frames for the groups should be stacked vertically, with a column indicating the index of the group. Ifdatais notNULL, it takes priority over any eventual data inSpoints.edge_numberColumn (or entry on the list) of the
datathat contains the edge numbers. If not supplied, the column with name "edge_number" will be chosen. Will not be used ifSpointsis notNULL.distance_on_edgeColumn (or entry on the list) of the
datathat contains the edge numbers. If not supplied, the column with name "distance_on_edge" will be chosen. Will not be used ifSpointsis notNULL.coord_xColumn (or entry on the list) of the
datathat contains the x coordinate. If not supplied, the column with name "coord_x" will be chosen. Will not be used ifSpointsis notNULLor ifdata_coordsisPtE.coord_yColumn (or entry on the list) of the
datathat contains the y coordinate. If not supplied, the column with name "coord_x" will be chosen. Will not be used ifSpointsis notNULLor ifdata_coordsisPtE.data_coordsIt decides which coordinate system to use. If
PtE, the user must provideedge_numberanddistance_on_edge, otherwise ifspatial, the user must providecoord_xandcoord_y. The optioneuclideanis.
Use spatialinstead.groupVector. If the data is grouped (for example measured at different time points), this argument specifies the columns (or entries on the list) in which the group variables are stored. It will be stored as a single column
.groupwith the combined entries.group_sepseparator character for creating the new group variable when grouping two or more variables.
normalizedif TRUE, then the distances in
distance_on_edgeare assumed to be normalized to (0,1). Default FALSE.formatWhich format should the data be returned? The options are
tibblefortidyr::tibble,sfforPOINT,spforSpatialPointsDataFrameandlistfor the internal list format.duplicated_strategyWhich strategy to handle observations on the same location on the metric graph (that is, if there are two or more observations projected at the same location). The options are 'closest' and 'jitter'. If 'closest', only the closest observation will be used. If 'jitter', a small perturbation will be performed on the projected observation location. The default is 'closest'.
include_distance_to_graphWhen
data_coordis 'spatial', should the distance of the observations to the graph be included as a column?only_return_removedShould the removed data (if it exists) when using 'closest'
duplicated_strategybe returned instead of the processed data?toleranceParameter to control a warning when adding observations. If the distance of some location and the closest point on the graph is greater than the tolerance, the function will display a warning. This helps detecting mistakes on the input locations when adding new data.
verboseIf
TRUE, report steps and times.suppress_warningsSuppress warnings related to duplicated observations?
Spoints- Use
datainstead. tibble- Use
formatinstead.
metric_graph$add_observations()
Add observations to the metric graph.
Usage
metric_graph$add_observations(
  data = NULL,
  edge_number = "edge_number",
  distance_on_edge = "distance_on_edge",
  coord_x = "coord_x",
  coord_y = "coord_y",
  data_coords = c("PtE", "spatial"),
  group = NULL,
  group_sep = ".",
  normalized = FALSE,
  clear_obs = FALSE,
  tibble = FALSE,
  tolerance = max(self$edge_lengths)/2,
  duplicated_strategy = "closest",
  include_distance_to_graph = TRUE,
  return_removed = TRUE,
  tolerance_merge = 0,
  merge_strategy = "merge",
  verbose = 1,
  suppress_warnings = FALSE,
  Spoints = lifecycle::deprecated()
)
Arguments
dataA
data.frameor named list containing the observations. In case of groups, the data.frames for the groups should be stacked vertically, with a column indicating the index of the group.datacan also be ansfobject, aSpatialPointsDataFrameobject or anSSNobject. in which casedata_coordswill automatically be spatial, and there is no need to specify thecoord_xorcoord_yarguments.edge_numberColumn (or entry on the list) of the
datathat contains the edge numbers. If not supplied, the column with name "edge_number" will be chosen. Will not be used ifSpointsis notNULL.distance_on_edgeColumn (or entry on the list) of the
datathat contains the edge numbers. If not supplied, the column with name "distance_on_edge" will be chosen. Will not be used ifSpointsis notNULL.coord_xColumn (or entry on the list) of the
datathat contains the x coordinate. If not supplied, the column with name "coord_x" will be chosen. Will not be used ifSpointsis notNULLor ifdata_coordsisPtE.coord_yColumn (or entry on the list) of the
datathat contains the y coordinate. If not supplied, the column with name "coord_x" will be chosen. Will not be used ifSpointsis notNULLor ifdata_coordsisPtE.data_coordsIt decides which coordinate system to use. If
PtE, the user must provideedge_numberanddistance_on_edge, otherwise ifspatial, the user must providecoord_xandcoord_y. The optioneuclideanis. Use spatialinstead.groupVector. If the data is grouped (for example measured at different time points), this argument specifies the columns (or entries on the list) in which the group variables are stored. It will be stored as a single column
.groupwith the combined entries.group_sepseparator character for creating the new group variable when grouping two or more variables.
normalizedif TRUE, then the distances in
distance_on_edgeare assumed to be normalized to (0,1). Default FALSE.clear_obsShould the existing observations be removed before adding the data?
tibbleShould the data be returned as a
tidyr::tibble?toleranceParameter to control a warning when adding observations. If the distance of some location and the closest point on the graph is greater than the tolerance, the function will display a warning. This helps detecting mistakes on the input locations when adding new data.
duplicated_strategyWhich strategy to handle observations on the same location on the metric graph (that is, if there are two or more observations projected at the same location). The options are 'closest' and 'jitter'. If 'closest', only the closest observation will be used. If 'jitter', a small perturbation will be performed on the projected observation location. The default is 'closest'.
include_distance_to_graphWhen
data_coordis 'spatial', should the distance of the observations to the graph be included as a column?return_removedShould the removed data (if it exists) due to being projected to the same place when using 'closest'
duplicated_strategy, or due to some merge strategy, be returned?tolerance_mergetolerance (in edge_length units) for merging points that are very close and are on a common edge. By default, this tolerance is zero, meaning no merges will be performed.
merge_strategyThe strategies to handle observations that are within the tolerance. The options are
remove,merge,average. The default ismerge, in which one of the observations will be chosen, and the remaining will be used to try to fill all columns with non-NA values. The second strategy isremove, meaning that if two observations are within the tolerance one of them will be removed. Finally,averagewill take the average over the close observations for numerical variables, and will choose one non-NA for non-numerical variables.verbosePrint progress of the steps when adding observations. There are 3 levels of verbose, level 0, 1 and 2. In level 0, no messages are printed. In level 1, only messages regarding important steps are printed. Finally, in level 2, messages detailing all the steps are printed. The default is 1.
suppress_warningsSuppress warnings related to duplicated observations?
Spoints- Use
datainstead.
metric_graph$mutate_weights()
Use dplyr::mutate function on the internal edge weights object.
Arguments
...Arguments to be passed to
dplyr::mutate()..drop_naShould the rows with at least one NA for one of the columns be removed? DEFAULT is
FALSE..drop_all_naShould the rows with all variables being NA be removed? DEFAULT is
TRUE.formatThe format of the output: "tibble", "sf", or "sp". Default is "tibble".
Details
A wrapper to use dplyr::mutate() on the internal edge weights
object and return the result in the requested format.
Returns
A tidyr::tibble, sf or sp object containing the resulting
data list after the mutate.
metric_graph$select_weights()
Use dplyr::select function on the internal edge weights object.
Arguments
...Arguments to be passed to
dplyr::select()..drop_naShould the rows with at least one NA for one of the columns be removed? DEFAULT is
FALSE..drop_all_naShould the rows with all variables being NA be removed? DEFAULT is
TRUE.formatThe format of the output: "tibble", "sf", or "sp". Default is "tibble".
Details
A wrapper to use dplyr::select() on the internal edge weights
object and return the result in the requested format.
Returns
A tidyr::tibble, sf or sp object containing the resulting
data list after the select.
metric_graph$filter_weights()
Use dplyr::filter function on the internal edge weights object.
Arguments
...Arguments to be passed to
dplyr::filter()..drop_naShould the rows with at least one NA for one of the columns be removed? DEFAULT is
FALSE..drop_all_naShould the rows with all variables being NA be removed? DEFAULT is
TRUE.formatThe format of the output: "tibble", "sf", or "sp". Default is "tibble".
Details
A wrapper to use dplyr::filter() on the internal edge weights
object and return the result in the requested format.
Returns
A tidyr::tibble, sf or sp object containing the resulting
data list after the filter.
metric_graph$summarise_weights()
Use dplyr::summarise function on the internal edge weights
object grouped by the edge numbers.
Usage
metric_graph$summarise_weights(
  ...,
  .groups = NULL,
  .drop_na = FALSE,
  .drop_all_na = TRUE,
  format = "tibble"
)
Arguments
...Arguments to be passed to
dplyr::summarise()..groupsA vector of strings containing the names of the columns to be grouped, when computing the summaries. The default is
NULL..drop_naShould the rows with at least one NA for one of the columns be removed? DEFAULT is
FALSE..drop_all_naShould the rows with all variables being NA be removed? DEFAULT is
TRUE.formatThe format of the output: "tibble", "sf", or "sp". Default is "tibble".
Details
A wrapper to use dplyr::summarise() on the internal edge weights
object and return the result in the requested format.
Returns
A tidyr::tibble, sf or sp object containing the resulting
data list after the summarise.
metric_graph$drop_na_weights()
Use tidyr::drop_na() function on the internal edge
weights object.
Arguments
...Arguments to be passed to
tidyr::drop_na().formatThe format of the output: "tibble", "sf", or "sp". Default is "tibble".
Details
A wrapper to use tidyr::drop_na() within the internal edge
weights object.
Returns
A tidyr::tibble, sf, or sp object containing the resulting
data list after the drop_na.
metric_graph$mutate()
Use dplyr::mutate function on the internal metric graph
data object.
Arguments
...Arguments to be passed to
dplyr::mutate()..drop_naShould the rows with at least one NA for one of the columns be removed? DEFAULT is
FALSE..drop_all_naShould the rows with all variables being NA be removed? DEFAULT is
TRUE.formatThe format of the output: "tibble", "sf", or "sp". Default is "tibble".
Details
A wrapper to use dplyr::mutate() within the internal metric graph
data object and return the result in the requested format.
Returns
A tidyr::tibble, sf, or sp object containing the resulting
data list after the mutate.
metric_graph$drop_na()
Use tidyr::drop_na() function on the internal metric graph
data object.
Arguments
...Arguments to be passed to
tidyr::drop_na().formatThe format of the output: "tibble", "sf", or "sp". Default is "tibble".
Returns
A tidyr::tibble object containing the resulting data list
after the drop_na.
metric_graph$select()
Use dplyr::select function on the internal metric graph
data object.
Arguments
...Arguments to be passed to
dplyr::select()..drop_naShould the rows with at least one NA for one of the columns be removed? DEFAULT is
FALSE..drop_all_naShould the rows with all variables being NA be removed? DEFAULT is
TRUE.formatThe format of the output: "tibble", "sf", or "sp". Default is "tibble".
Details
A wrapper to use dplyr::select() within the internal metric
graph data object. Observe that it is a bit different from directly
using dplyr::select() since it does not allow to remove the internal
positions that are needed for the metric_graph methods to work.
Returns
A tidyr::tibble object containing the resulting data list
after the selection.
metric_graph$filter()
Use dplyr::filter function on the internal metric graph
data object.
Arguments
...Arguments to be passed to
dplyr::filter()..drop_naShould the rows with at least one NA for one of the columns be removed? DEFAULT is
FALSE..drop_all_naShould the rows with all variables being NA be removed? DEFAULT is
TRUE.formatThe format of the output: "tibble", "sf", or "sp". Default is "tibble".
Details
A wrapper to use dplyr::filter() within the internal metric
graph data object.
Returns
A tidyr::tibble object containing the resulting data list
after the filter.
metric_graph$summarise()
Use dplyr::summarise function on the internal metric graph
data object grouped by the spatial locations and the internal group variable.
Usage
metric_graph$summarise(
  ...,
  .include_graph_groups = FALSE,
  .groups = NULL,
  .drop_na = FALSE,
  .drop_all_na = TRUE,
  format = "tibble"
)
Arguments
...Arguments to be passed to
dplyr::summarise()..include_graph_groupsShould the internal graph groups be included in the grouping variables? The default is
FALSE. This means that, when summarising, the data will be grouped by the internal group variable together with the spatial locations..groupsA vector of strings containing the names of the columns to be additionally grouped, when computing the summaries. The default is
NULL..drop_naShould the rows with at least one NA for one of the columns be removed? DEFAULT is
FALSE..drop_all_naShould the rows with all variables being NA be removed? DEFAULT is
TRUE.formatThe format of the output: "tibble", "sf", or "sp". Default is "tibble".
Details
A wrapper to use dplyr::summarise() within the internal metric
graph data object grouped by manually inserted groups (optional), the
internal group variable (optional) and the spatial locations. Observe
that if the integral group variable was not used as a grouping variable
for the summarise, a new column, called .group, will be added, with the
same value 1 for all rows.
Returns
A tidyr::tibble object containing the resulting data list after
the summarise.
metric_graph$get_data()
Return the internal data with the option to filter by groups.
Usage
metric_graph$get_data(
  group = NULL,
  format = c("tibble", "sf", "sp", "list"),
  drop_na = FALSE,
  drop_all_na = TRUE,
  tibble = deprecated()
)
Arguments
groupA vector contaning which groups should be returned? The default is
NULL, which gives the result for the all groups.formatWhich format should the data be returned? The options are
tibblefortidyr::tibble,sfforPOINT,spforSpatialPointsDataFrameandlistfor the internal list format.drop_naShould the rows with at least one NA for one of the columns be removed? DEFAULT is
FALSE.drop_all_naShould the rows with all variables being NA be removed? DEFAULT is
TRUE.tibble- Use
formatinstead.
metric_graph$setDirectionalWeightFunction()
Define the columns to be used for creating the directional vertex weights. Also possible to supply user defined functions for input and output to create ones own weights.
metric_graph$buildDirectionalConstraints()
Build directional ODE constraint matrix from edges.
metric_graph$buildC()
Build Kirchoff constraint matrix from edges.
metric_graph$build_mesh()
Builds mesh object for graph.
Usage
metric_graph$build_mesh(
  h = NULL,
  n = NULL,
  continuous = TRUE,
  continuous.outs = FALSE,
  continuous.deg2 = FALSE
)
Arguments
hMaximum distance between mesh nodes (should be provided if n is not provided).
nMaximum number of nodes per edge (should be provided if h is not provided).
continuousIf
TRUE(default), the mesh contains only one node per vertex. IfFALSE, each vertex v is split into deg(v) disconnected nodes to allow for the creation of discontinuities at the vertices.continuous.outsIf
continuous = FALSEandcontinuous.outs = TRUE, continuity is assumed for the outgoing edges from each vertex.continuous.deg2If
TRUE, continuity is assumed at degree 2 vertices.
Details
The mesh is a list with the objects:
PtEThe mesh locations excluding the original vertices;VThe verties of the mesh;EThe edges of the mesh;n_eThe number of vertices in the mesh per original edge in the graph;h_eThe mesh width per edge in the graph;indThe indices of the vertices in the mesh;VtEAll mesh locations including the original vertices.
metric_graph$is_disconnected()
Does this graph have more than one connected component? The decomposition is computed and cached at construction time, so this is an O(1) lookup.
metric_graph$get_components()
Return the connected components of the graph as a
list of metric_graph objects. For a connected graph this is
simply list(self). For a disconnected graph, the components are
returned in order of decreasing total edge length and any
observations stored on self are routed to the appropriate
component. The result is cached internally; subsequent calls are
O(1) until observations change (which invalidates the cache).
metric_graph$which_component()
For each spatial point, determine which connected component of the graph it belongs to. The component is the one whose nearest edge is closest in Euclidean distance to the point.
metric_graph$compute_fem()
Build mass and stiffness matrices for given mesh object.
Arguments
petrovCompute Petrov-Galerkin matrices? (default
FALSE). These are defined as \(Cpet_{ij} = <\phi_i, \psi_j>\) and \(Gpet_{ij} = <d\phi_i, \psi_j>\), where \(\psi_{i}\) are piecewise constant basis functions on the edges of the mesh.
Details
The function builds: The matrix C which is the mass matrix with
elements \(C_{ij} = <\phi_i, \phi_j>\), the matrix G which is the stiffness
matrix with elements \(G_{ij} = <d\phi_i, d\phi_j>\), the matrix B with
elements \(B_{ij} = <d\phi_i, \phi_j>\), the matrix D with elements
\(D_{ij} = \sum_{v\in V}\phi_i(v)\phi_j(v)\), and the vector with weights
\(<\phi_i, 1>\).
metric_graph$mesh_A()
Deprecated - Computes observation matrix for mesh.
in favour of metric_graph$fem_basis().
metric_graph$fem_basis()
Computes observation matrix for mesh.
metric_graph$plot()
Plots the metric graph.
Usage
metric_graph$plot(
  data = NULL,
  newdata = NULL,
  group = 1,
  type = c("ggplot", "plotly", "mapview"),
  interactive = FALSE,
  vertex_size = 3,
  vertex_color = "black",
  edge_width = 0.3,
  edge_color = "black",
  data_size = 1,
  support_width = 0.5,
  support_color = "gray",
  mesh = FALSE,
  X = NULL,
  X_loc = NULL,
  p = NULL,
  degree = FALSE,
  direction = FALSE,
  arrow_size = ggplot2::unit(0.25, "inches"),
  edge_weight = NULL,
  edge_width_weight = NULL,
  scale_color_main = ggplot2::scale_color_viridis_c(option = "D"),
  scale_color_weights = ggplot2::scale_color_viridis_c(option = "C"),
  scale_color_degree = ggplot2::scale_color_viridis_d(option = "D"),
  scale_color_weights_discrete = ggplot2::scale_color_viridis_d(option = "C"),
  scale_color_main_discrete = ggplot2::scale_color_viridis_d(option = "C"),
  add_new_scale_weights = TRUE,
  scale_color_mapview = viridis::viridis(100, option = "D"),
  scale_color_weights_mapview = viridis::viridis(100, option = "C"),
  scale_color_weights_discrete_mapview = NULL,
  scale_color_degree_mapview = NULL,
  plotly = deprecated(),
  components = FALSE,
  ...
)
Arguments
dataWhich column of the data to plot? If
NULL, no data will be plotted.newdataA dataset of class
metric_graph_data, obtained by anyget_data(),mutate(),filter(),summarise(),drop_na()methods of metric graphs, see the vignette on data manipulation for more details.groupIf there are groups, which group to plot? If
groupis a number andnewdataisNULL, it will be the index of the group as stored internally and ifnewdatais provided, it will be the index of the group stored innewdata. Ifgroupis a character, then the group will be chosen by its name.typeThe type of plot to be returned. The options are
ggplot(the default), that usesggplot2;plotlythat usesplot_lyfor 3D plots, which requires theplotlypackage, andmapviewthat uses themapviewfunction, to build interactive plots, which requires themapviewpackage.interactiveOnly works for 2d plots. If
TRUE, an interactive plot will be displayed. Unfortunately,interactiveis not compatible withedge_weightifadd_new_scale_weightsis TRUE.vertex_sizeSize of the vertices.
vertex_colorColor of vertices.
edge_widthLine width for edges. If
edge_width_weightis notNULL, this determines the maximum edge width.edge_colorColor of edges.
data_sizeSize of markers for data.
support_widthFor 3D plot, width of support lines.
support_colorFor 3D plot, color of support lines.
meshPlot the mesh locations?
XAdditional values to plot.
X_locLocations of the additional values in the format (edge, normalized distance on edge).
pExisting objects obtained from 'ggplot2' or 'plotly' to add the graph to
degreeShow the degrees of the vertices?
directionShow the direction of the edges? For
type == "mapview"the arrows are not shown, only the color of the vertices indicating whether they are problematic or not.arrow_sizeThe size of the arrows if direction is TRUE.
edge_weightWhich column from edge weights to determine the colors of the edges? If
NULLedge weights are not plotted. To plot the edge weights when the metric graphedge_weightsis a vector instead of adata.frame, simply set to 1.edge_weightis only available for 2d plots. For 3d plots with edge weights, please use theplot_function()method.edge_width_weightWhich column from edge weights to determine the edges widths? If
NULLedge width will be determined fromedge_width. Currently it is not supported fortype = "mapview".scale_color_mainColor scale for the data to be plotted.
scale_color_weightsColor scale for the edge weights. Will only be used if
add_new_scale_weightsis TRUE.scale_color_degreeColor scale for the degrees.
scale_color_weights_discreteColor scale for discrete edge weights. Will only be used if
add_new_scale_weightsis TRUE.scale_color_main_discreteColor scale for the data to be plotted, for discrete data.
add_new_scale_weightsShould a new color scale for the edge weights be created?
scale_color_mapviewColor scale to be applied for data when
type = "mapview".scale_color_weights_mapviewColor scale to be applied for edge weights when
type = "mapview".scale_color_weights_discrete_mapviewColor scale to be applied for degrees when
type = "mapview". IfNULLRColorBrewer::brewer.pal(n = n_weights, "Set1")will be used wheren_weightsis the number of different degrees.scale_color_degree_mapviewColor scale to be applied for degrees when
type = "mapview". IfNULLRColorBrewer::brewer.pal(n = n_degrees, "Set1")will be used wheren_degreesis the number of different degrees.plotly- Use
typeinstead. componentsColor the connected components separately. Either
FALSE(the default; the graph is plotted as-is),TRUE(each component is drawn in a randomly-chosen color), or ann x 3numeric matrix of RGB values in[0, 1](one row per component, indices matchingget_components())....Additional arguments to pass to
ggplot()orplot_ly()
metric_graph$plot_function()
Plots continuous function on the graph.
Usage
metric_graph$plot_function(
  data = NULL,
  newdata = NULL,
  group = 1,
  type = c("ggplot", "plotly", "mapview"),
  continuous = TRUE,
  interpolate_plot = TRUE,
  edge_weight = NULL,
  vertex_size = 5,
  vertex_color = "black",
  edge_width = 1,
  edge_color = "black",
  line_width = NULL,
  line_color = "rgb(0,0,200)",
  scale_color = ggplot2::scale_color_viridis_c(option = "D"),
  scale_color_mapview = viridis::viridis(100, option = "D"),
  support_width = 0.5,
  support_color = "gray",
  mapview_caption = "Function",
  p = NULL,
  plotly = deprecated(),
  improve_plot = deprecated(),
  X = deprecated(),
  ...
)
Arguments
dataWhich column of the data to plot? If
NULL, no data will be plotted.newdataA dataset of class
metric_graph_data, obtained by anyget_data(),mutate(),filter(),summarise(),drop_na()methods of metric graphs, see the vignette on data manipulation for more details.groupIf there are groups, which group to plot? If
groupis a number, it will be the index of the group as stored internally. Ifgroupis a character, then the group will be chosen by its name.typeThe type of plot to be returned. The options are
ggplot(the default), that usesggplot2;plotlythat usesplot_lyfor 3D plots, which requires theplotlypackage, andmapviewthat uses themapviewfunction, to build interactive plots, which requires themapviewpackage.continuousShould continuity be assumed when the plot uses
newdata?interpolate_plotShould the values to be plotted be interpolated?
edge_weightWhich column from edge weights to plot? If
NULLedge weights are not plotted. To plot the edge weights when the metric graphedge_weightsis a vector instead of adata.frame, simply set to 1.vertex_sizeSize of the vertices.
vertex_colorColor of vertices.
edge_widthWidth for edges.
edge_colorFor 3D plot, color of edges.
line_widthFor 3D plot, line width of the function curve.
line_colorColor of the function curve.
scale_colorColor scale to be used for data and weights.
scale_color_mapviewColor scale to be applied for data when
type = "mapview".support_widthFor 3D plot, width of support lines.
support_colorFor 3D plot, color of support lines.
mapview_captionCaption for the function if
type = "mapview".pPrevious plot to which the new plot should be added.
plotly- Use
typeinstead. improve_plot- Use
interpolateinstead. There is no need to use it to improve the edges. X- Use
newdatainstead. ...Additional arguments for
ggplot()orplot_ly()
metric_graph$plot_movie()
Plots a movie of a continuous function evolving on the graph.
Usage
metric_graph$plot_movie(
  X,
  type = "plotly",
  vertex_size = 5,
  vertex_color = "black",
  edge_width = 1,
  edge_color = "black",
  line_width = NULL,
  line_color = "rgb(0,0,200)",
  ...
)
Arguments
XA m x T matrix where the ith column represents the function at the ith time, evaluated at the mesh locations.
typeType of plot. Either
"plotly"or"ggplot".vertex_sizeSize of the vertices.
vertex_colorColor of vertices.
edge_widthWidth for edges.
edge_colorFor 3D plot, color of edges.
line_widthFor 3D plot, line width of the function curve.
line_colorColor of the function curve.
...Additional arguments for ggplot or plot_ly.
metric_graph$add_mesh_observations()
Add observations on mesh to the object.
Arguments
dataA
data.frameor named list containing the observations. In case of groups, the data.frames for the groups should be stacked vertically, with a column indicating the index of the group. Ifdata_frameis notNULL, it takes priority over any eventual data inSpoints.groupIf the data_frame contains groups, one must provide the column in which the group indices are stored.
metric_graph$update_graph()
Update an older version metric graph to the current package version.
Details
This function creates a new metric_graph object from an existing one, preserving all data, edge weights, mesh, distances, and other components while ensuring compatibility with the current package version. The new graph is created with minimal changes by disabling merges and other transformations.
metric_graph$coordinates()
Convert between locations on the graph and Euclidean coordinates.
Arguments
PtEMatrix with locations on the graph (edge number and normalized position on the edge).
XYMatrix with locations in Euclidean space
normalizedIf
TRUE, it is assumed that the positions inPtEare normalized to (0,1), and the object returned ifXYis specified contains normalized locations.
Returns
If PtE is specified, then a matrix with Euclidean coordinates of
the locations is returned. If XY is provided, then a matrix with the
closest locations on the graph is returned.
Gets the edge weights
data.frame If the edge weights are given as vectors, should the result
be returned as a data.frame?
A vector or data.frame containing the edge weights.
data List containing data on the metric graph.
Examples
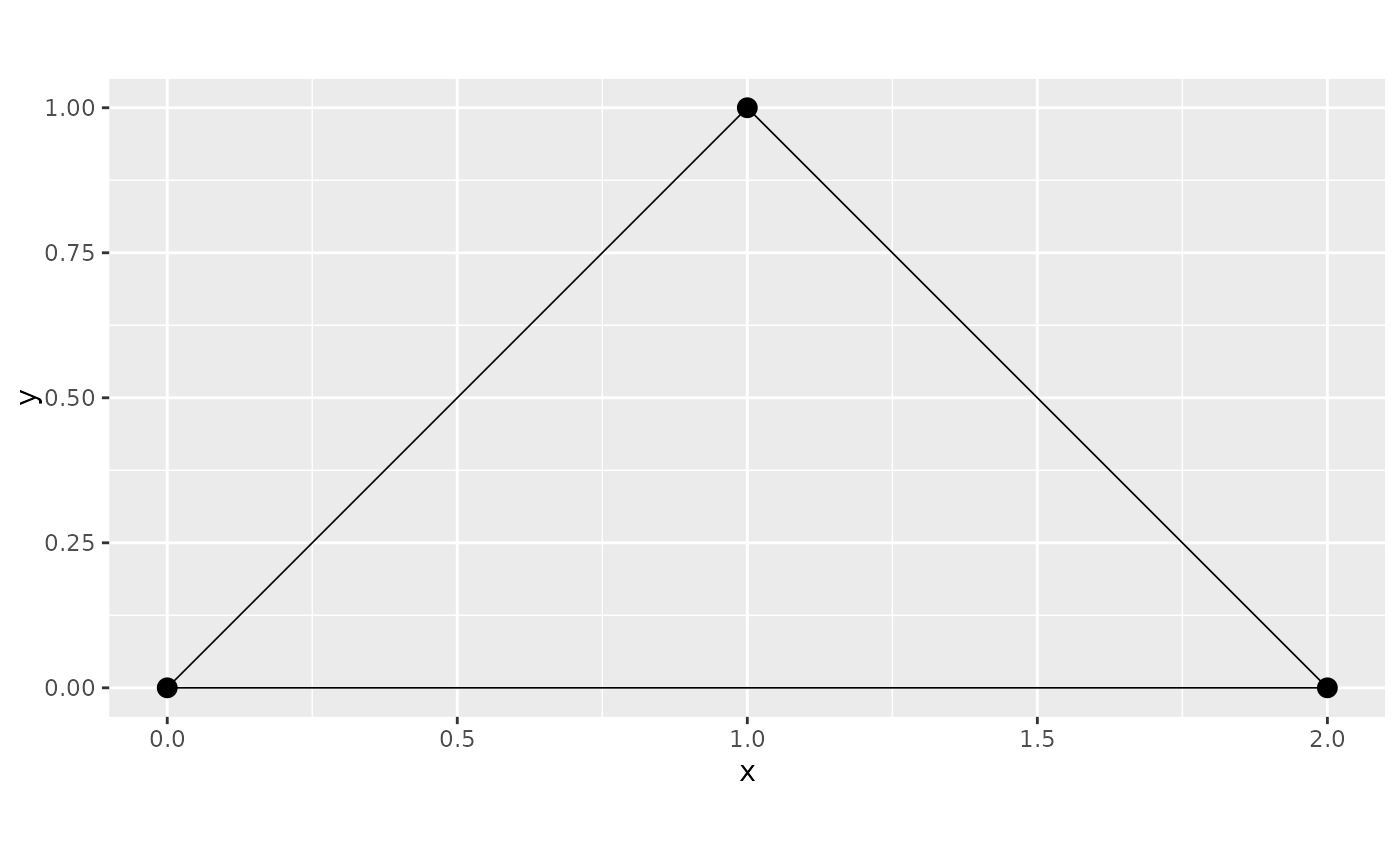
edge1 <- rbind(c(0, 0), c(2, 0))
edge2 <- rbind(c(2, 0), c(1, 1))
edge3 <- rbind(c(1, 1), c(0, 0))
edges <- list(edge1, edge2, edge3)
graph <- metric_graph$new(edges)
#> Starting graph creation...
#> LongLat is set to FALSE
#> Creating edges...
#> Setting edge weights...
#> Computing bounding box...
#> Setting up edges
#> Merging close vertices
#> Total construction time: 0.30 secs
#> Creating and updating vertices...
#> Storing the initial graph...
#> Computing the relative positions of the edges...
graph$plot()